

The self-storage market is entering a different phase. The national demand drivers operators once counted on are less reliable, and local conditions are doing more to shape performance across the self-storage industry. Fewer people are moving, tenants are staying longer, and rate growth looks different from one market to the next.
That combination changes the growth equation. New move-ins still matter, but so do renewals, length of stay and the pricing decisions operators make for each facility.
The numbers in our latest report, The 2026 State of the Self-Storage Industry, offer a closer look at these self-storage market trends and where operators should focus in 2027.
Download The 2026 State of the Self-Storage Industry
Longer stays put retention in sharper focus
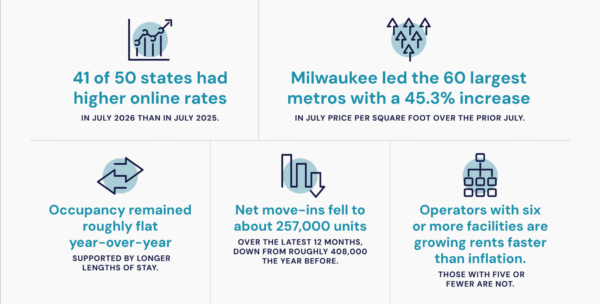
Fewer moves mean fewer new renters entering the market, but they also mean existing customers are moving out less often. Longer stays have helped keep the occupancy rate steady and churn low, even as move-in volume has fallen.
That makes retention a more important part of growth. Operators should understand why tenants rent, since someone who needs more room at home may stay longer than someone storing belongings during a move. Their needs, timing and response to outreach may differ, too.
Length of stay belongs alongside occupancy and net move-ins in regular performance reviews. Watching move-outs weekly during the summer, when seasonal patterns shift, also gives teams more time to respond before departures show up in occupancy. Renewal outreach and targeted promotions offer ways to act on those signals without relying only on new customer acquisition.
Storage rates have not closed the inflation gap
Storage unit rates have shown nominal growth. Online reserved rates rose year over year every month from January through July 2026, the first time that had happened since 2022. In July, 41 of 50 states had higher online rates than a year earlier, with a median increase of 3.7%.
But nominal growth does not tell the whole story. Once adjusted for inflation, rates are flat and remain below their 2022 peak in most states. And recovery is far from uniform: half of the 60 largest metros raised prices between July 2025 and July 2026, while half cut them.
Regional results show why local comparisons matter. Midwest metros averaged an 11.6% increase in price per square foot over that period, led by Milwaukee at 45.3%. Elsewhere, markets faced softer pricing or more competition from new supply.
These figures point to opportunity in some places, not a signal for a broad rate increase everywhere. Before changing prices, operators should review local supply, compare rates by unit size and consider how an increase may affect churn and length of stay. A higher rate is most valuable when it supports revenue without pushing away customers who would otherwise stay.
A more focused storage industry outlook for 2027
The market is not moving in one direction, so a single national strategy is unlikely to fit every facility. Operators should set targets by submarket, compare each property with its own history, and bring occupancy, length of stay, move-ins, move-outs and achieved rent into the same regular review.
The next phase of self-storage growth will depend on reading local conditions, keeping tenants longer and pricing with the inflation gap in view. The full ebook explores those trends with state and metro rate tables and data from more than 30,000 facilities.
How is Storable’s State of the Industry report different from other self-storage resources?
Storable is able to provide a connected view of the self-storage market. The most comprehensive view of self-storage, informed by 30,000+ facilities, Marketplace reservation trends, and consumer search signals.
No single metric explains how a storage market is performing. This report brings together complementary signals to show what is happening inside facilities and what prospective tenants are doing before they rent. Together, these perspectives help operators put market signals in context and decide what to investigate in their own facilities.
- Inside facilities: Storable software data shows occupancy, move-ins, move-outs, rent, and length-of-stay patterns.
- Before a rental: Storable Marketplace reservation data adds online reserved rates and demand by market. Google Trends adds a view of search interest, an indicator of what people are looking for, not a count of completed rentals.
- Across markets: State, metro, regional, and operator-size views help show where national patterns hold and where local conditions differ.
Download The 2026 State of the Self-Storage Industry to dig deeper into the numbers and see how your facility is performing against your competitors.